|
In the dust-free case, surface stress associated with
km-size convection reaches a fairly large value
in the afternoon when convective activity becomes the
highest
(Figure 5).
Surface stress in the afternoon cirtainly exceeds
the threshold value required to raise dust from the
surface, considering a superposition of
a large scale background wind on the
convective wind
(Figure 6).
In order to realize dust injection into the atmosphere
in our convection model utilized in this study,
we have to incorporate
a large scale background wind
into the model.
However, since
- it is exepcted that
the circulation structure of
km-size thermal convection will be affected not only by
dust but also by the background wind,
- it is not desirable to have an effect of
large scale background wind on the structure of
km-size convection,
since we are focusing on the effect of dust on
the structure of km-size convection
in this study,
in the followings,
we do not adapt the model to incorporate
a large scale background wind
for realizing spontaneous dust injection,
but
we adopt an artificial setup where
the value of the threshold surface stress is adjusted
so that dust injection occurs by the wind
associated with km-size convection in the afternoon.
The adjusted value of the threshold surface stress is 0.01 Pa.
This value is adopted
based on the results of the dust-free case
that
the maximum value of
surface stress exceeds 0.01 Pa in the afternoon
(Figure 5),
and
the value of
surface stress
frequently
exceeds 0.01 Pa at several grid points
(Figure 6).
The initial condition is the result
of the dust-free case at LT=6:00 of the 6th day.
The numerical integration is performed for 6 days.
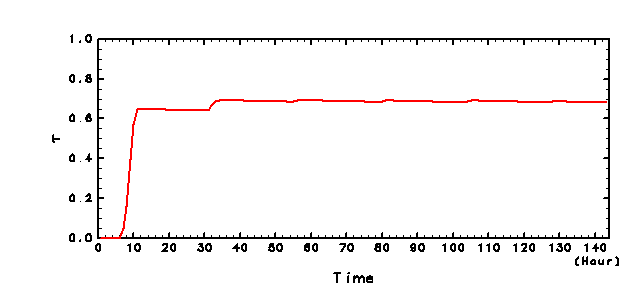
Figure 9 shows time development of
horizontal mean dust opacity for solar radiation (λ
= 0.67 μm).
Dust opacity rapidly increases in the first day,
and after that,
it keeps almost a constant value (about 0.07).
In the followings, we show features of dust mixing
from the first to second day,
and resluts on the 6th day at which
the model reaches almost an equilibrium state.
- Feature of dust mixing
- Horizontal mean fields
- Circulation structure of convection

|
|
Figure 9:
Time development of horizontal mean dust opacity for
solar radiation.
Horizontal axis denotes numerical integration time from the initial.
|
|