|
4.a. Feature of dust mixing (1)
|

|
|
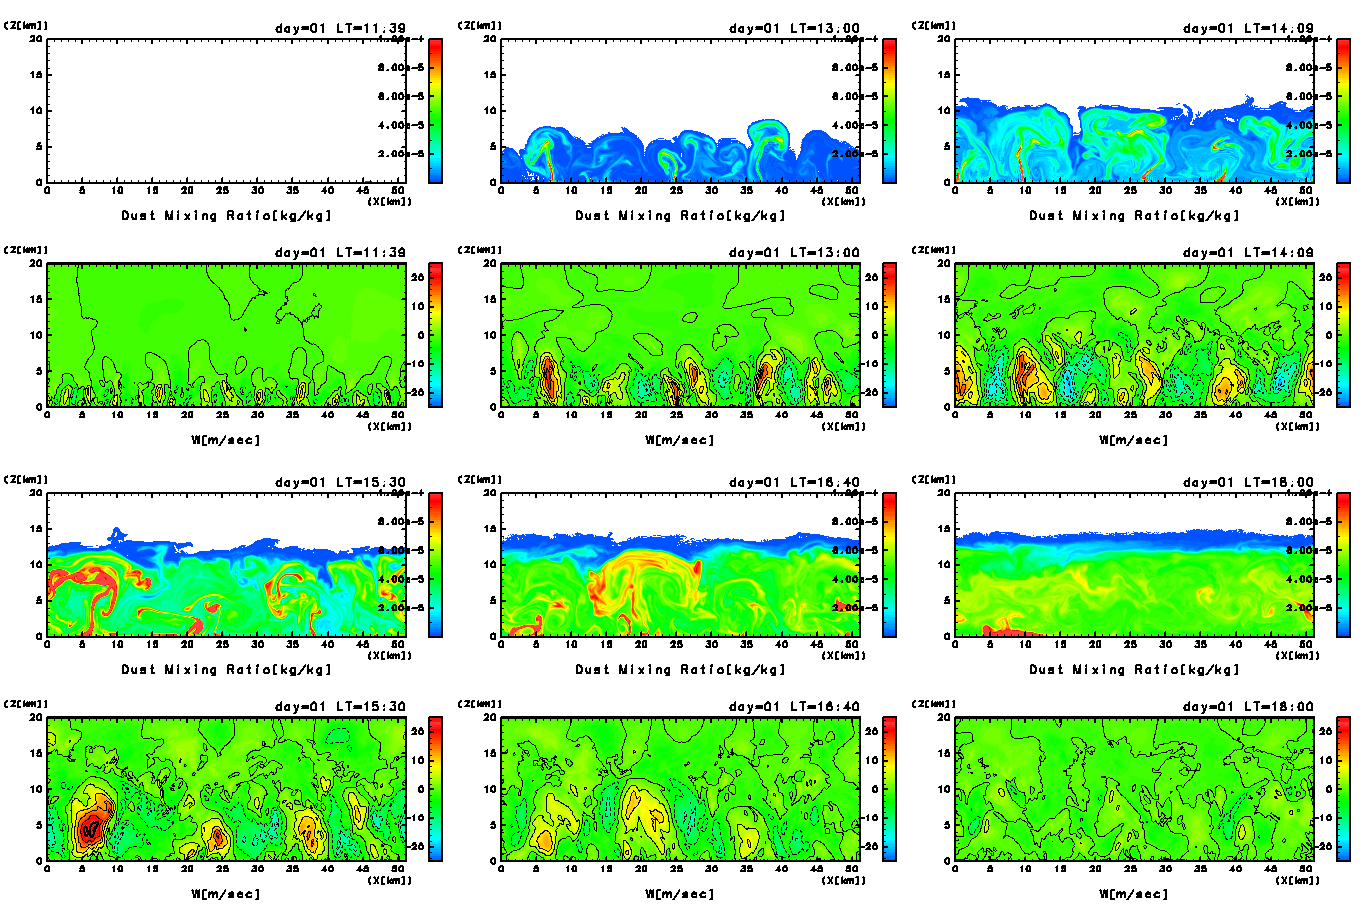
Figure 10a:
Dust mixing of the first day after the switch-on of dust
injection.
Results of every 10 minutes from LT = 11:39 to 18:00 are
shown.
(Upper panel) Mixing ratio of dust (kg/kg).
Areas of the value of dust mixing ratio larger than
1.0×10⁻⁸ kg/kg are
colored.
(Lower panel) Vertical wind velocity.
Contour interval is 5 msec-1.
|
Figure 10a (upper panel) shows
dust mixing of the first day after the switch-on of dust
injection.
Dust is well mixed within two to three hours by the
convective plumes.
Immediately after the switch-on of dust injection,
large dust mixing ratio is observed within
the ascending regions, especially convective plumes.
At around LT=14:00, about two hours after the switch-on,
dust spreads over the whole of the convection layer.
At LT=17:00, the distribution of dust below about 10 km
height becomes almost uniform horizontally and
vertically.
During the development stage of dust mixing,
there may be an effect of differential radiative heating
between the ascending regions where dust mixing ratio
is large and other regions where that is small.
However, the differential heating does not seem
to have large effects on the circulation patterns of
convection.
Similar to the results of the dust-free case
(Figure 4 (upper
right panel)),
the aspect ratio of convective cell remains about 2 to 1,
and
the width of updraft region is almost equal to that of
downdraft (Figure 10a (lower
panel)).
It might be observed that,
owing to the dust absorption of solar radiation,
the intensity of downdraft be reduced a little
compared to that of updraft.
However, the amount of decrease, if any, is only
within the range
which requires some detailed analyses to show
its statistical significancy.
The results indicate that,
before radiative heat contrast
affects the circulation pattern of convection,
dust spreads over the whole convection layer
and consequently its effect is weakened.
Dust can be regarded as a passive tracer
during the stage of dust injection and mixing.
|